Integrating Cite-seq
Load libraries and data
[1]:
from sklearn.preprocessing import normalize
from matplotlib import pyplot as plt
from mudata import MuData
import seaborn as sns
import mudata as md
import scanpy as sc
import muon as mu
import numpy as np
import anndata
/mnt/iusers01/fatpou01/bmh01/t48955xm/.conda/envs/maxxxxxxxin/lib/python3.9/site-packages/tqdm/auto.py:22: TqdmWarning: IProgress not found. Please update jupyter and ipywidgets. See https://ipywidgets.readthedocs.io/en/stable/user_install.html
  from .autonotebook import tqdm as notebook_tqdm
[2]:
data = sc.read_h5ad("./cite-seq/GSE194122_openproblems_neurips2021_cite_BMMC_processed.h5ad")
/mnt/iusers01/fatpou01/bmh01/t48955xm/.conda/envs/maxxxxxxxin/lib/python3.9/site-packages/anndata/_core/anndata.py:1830: UserWarning: Variable names are not unique. To make them unique, call `.var_names_make_unique`.
  utils.warn_names_duplicates("var")
[3]:
data
[3]:
AnnData object with n_obs × n_vars = 90261 × 14087
    obs: 'GEX_n_genes_by_counts', 'GEX_pct_counts_mt', 'GEX_size_factors', 'GEX_phase', 'ADT_n_antibodies_by_counts', 'ADT_total_counts', 'ADT_iso_count', 'cell_type', 'batch', 'ADT_pseudotime_order', 'GEX_pseudotime_order', 'Samplename', 'Site', 'DonorNumber', 'Modality', 'VendorLot', 'DonorID', 'DonorAge', 'DonorBMI', 'DonorBloodType', 'DonorRace', 'Ethnicity', 'DonorGender', 'QCMeds', 'DonorSmoker', 'is_train'
    var: 'feature_types', 'gene_id'
    uns: 'dataset_id', 'genome', 'organism'
    obsm: 'ADT_X_pca', 'ADT_X_umap', 'ADT_isotype_controls', 'GEX_X_pca', 'GEX_X_umap'
    layers: 'counts'
[13]:
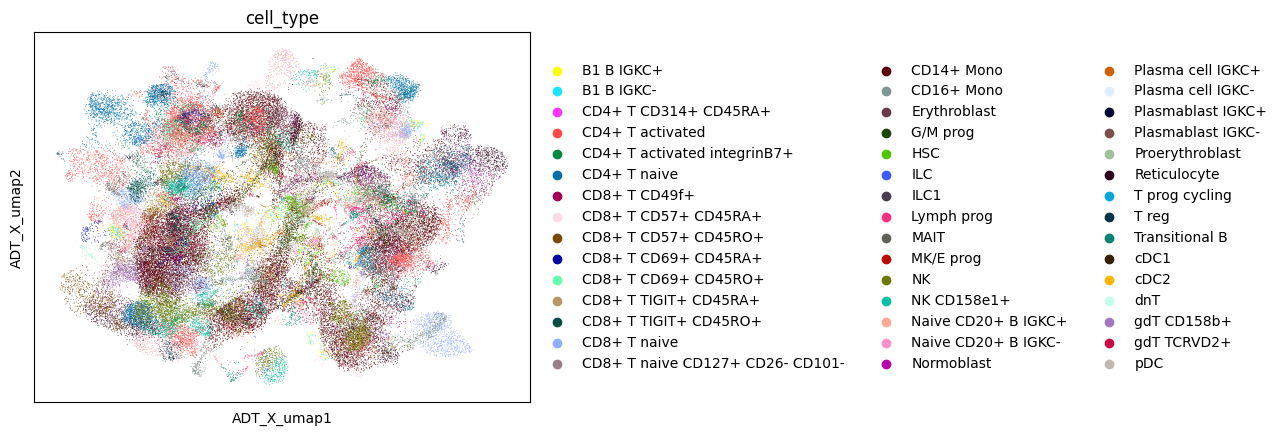
sc.pl.embedding(data, color ='cell_type', basis='ADT_X_umap')
sc.pl.embedding(data, color ='cell_type', basis='GEX_X_umap')
/mnt/iusers01/fatpou01/bmh01/t48955xm/.conda/envs/maxxxxxxxin/lib/python3.9/site-packages/scanpy/plotting/_tools/scatterplots.py:392: UserWarning: No data for colormapping provided via 'c'. Parameters 'cmap' will be ignored
  cax = scatter(
/mnt/iusers01/fatpou01/bmh01/t48955xm/.conda/envs/maxxxxxxxin/lib/python3.9/site-packages/scanpy/plotting/_tools/scatterplots.py:392: UserWarning: No data for colormapping provided via 'c'. Parameters 'cmap' will be ignored
  cax = scatter(

[10]:
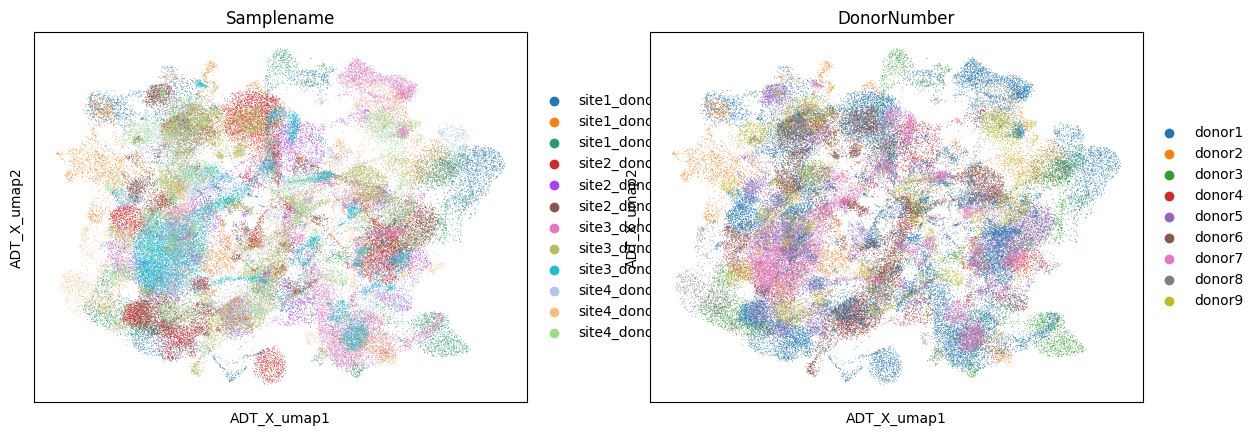
sc.pl.embedding(data, color =['Samplename','DonorNumber'] , basis='ADT_X_umap')
/mnt/iusers01/fatpou01/bmh01/t48955xm/.conda/envs/maxxxxxxxin/lib/python3.9/site-packages/scanpy/plotting/_tools/scatterplots.py:392: UserWarning: No data for colormapping provided via 'c'. Parameters 'cmap' will be ignored
  cax = scatter(
/mnt/iusers01/fatpou01/bmh01/t48955xm/.conda/envs/maxxxxxxxin/lib/python3.9/site-packages/scanpy/plotting/_tools/scatterplots.py:392: UserWarning: No data for colormapping provided via 'c'. Parameters 'cmap' will be ignored
  cax = scatter(
[16]:
adata = data[data.obs['DonorNumber']== 'donor1', :]
[20]:
adata
[20]:
View of AnnData object with n_obs × n_vars = 30669 × 14087
    obs: 'GEX_n_genes_by_counts', 'GEX_pct_counts_mt', 'GEX_size_factors', 'GEX_phase', 'ADT_n_antibodies_by_counts', 'ADT_total_counts', 'ADT_iso_count', 'cell_type', 'batch', 'ADT_pseudotime_order', 'GEX_pseudotime_order', 'Samplename', 'Site', 'DonorNumber', 'Modality', 'VendorLot', 'DonorID', 'DonorAge', 'DonorBMI', 'DonorBloodType', 'DonorRace', 'Ethnicity', 'DonorGender', 'QCMeds', 'DonorSmoker', 'is_train'
    var: 'feature_types', 'gene_id'
    uns: 'dataset_id', 'genome', 'organism', 'cell_type_colors', 'Samplename_colors', 'DonorNumber_colors'
    obsm: 'ADT_X_pca', 'ADT_X_umap', 'ADT_isotype_controls', 'GEX_X_pca', 'GEX_X_umap'
    layers: 'counts'
[19]:
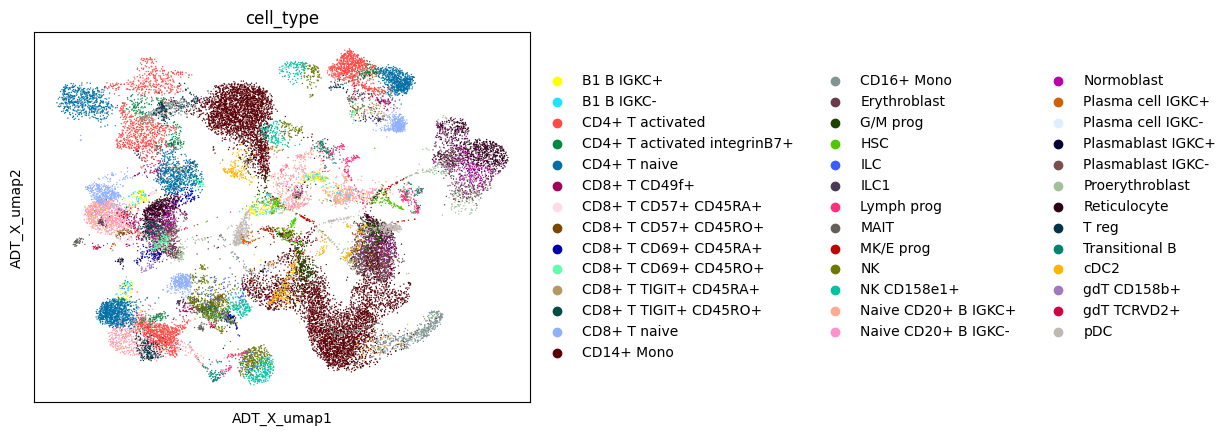
sc.pl.embedding(adata, color ='cell_type', basis='ADT_X_umap')
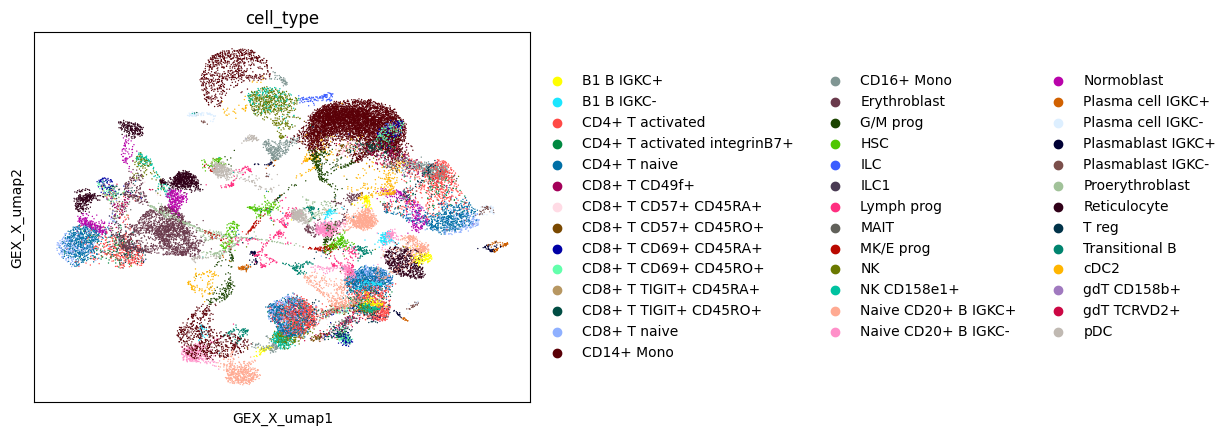
sc.pl.embedding(adata, color ='cell_type', basis='GEX_X_umap')
/mnt/iusers01/fatpou01/bmh01/t48955xm/.conda/envs/maxxxxxxxin/lib/python3.9/site-packages/scanpy/plotting/_tools/scatterplots.py:392: UserWarning: No data for colormapping provided via 'c'. Parameters 'cmap' will be ignored
  cax = scatter(
/mnt/iusers01/fatpou01/bmh01/t48955xm/.conda/envs/maxxxxxxxin/lib/python3.9/site-packages/scanpy/plotting/_tools/scatterplots.py:392: UserWarning: No data for colormapping provided via 'c'. Parameters 'cmap' will be ignored
  cax = scatter(
PREPROCESSING (Customized)
We use scanpy for the feature screening
[21]:
X = adata.X
X_gene = X[:,adata.var['feature_types']=='GEX']
X_adt = X[:,adata.var['feature_types']=='ADT']
[22]:
X_gene.shape, X_adt.shape
[22]:
((30669, 13953), (30669, 134))
[23]:
Agene = sc.AnnData(X_gene)
[24]:
Adt = sc.AnnData(X_adt)
[25]:
sc.pp.filter_genes(Agene, min_cells = 50)
[26]:
sc.pp.normalize_total(Agene, target_sum=1e4)
sc.pp.log1p(Agene)
[27]:
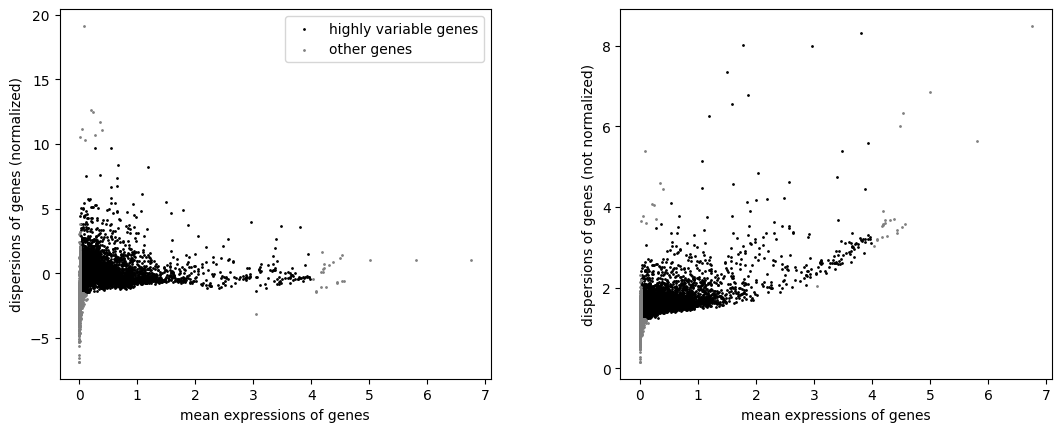
sc.pp.highly_variable_genes(Agene, min_mean=0.02, max_mean=4, min_disp= -1.5, max_disp = 10)
sc.pl.highly_variable_genes(Agene)
[29]:
HVG = Agene[:, Agene.var['highly_variable'] == True]
construct MuData object
[52]:
mdata = MuData({"rna": HVG, "adt": Adt})
/mnt/iusers01/fatpou01/bmh01/t48955xm/.conda/envs/maxxxxxxxin/lib/python3.9/site-packages/mudata/_core/mudata.py:458: UserWarning: Cannot join columns with the same name because var_names are intersecting.
  warnings.warn(
[54]:
mdata.obs.index = adata.obs.index
mdata.obs['celltype'] = adata.obs['cell_type']
mdata.obsm = adata.obsm
[55]:
mdata
[55]:
MuData object with n_obs × n_vars = 30669 × 11863
  obs:      'celltype'
  obsm:     'ADT_X_pca', 'ADT_X_umap', 'ADT_isotype_controls', 'GEX_X_pca', 'GEX_X_umap'
  2 modalities
    rna:    30669 x 11729
      var:  'n_cells', 'highly_variable', 'means', 'dispersions', 'dispersions_norm', 'group'
      uns:  'log1p', 'hvg'
    adt:    30669 x 134
      var:  'group'
Training
[44]:
import TriTan
Customize your TriTan model
decide the number of the svd components for each mod
[56]:
svd = {'rna': [50,300], 'adt': [50,300]}
[57]:
tritan= TriTan.TriTan(n_component= svd, resolution = 1)
[58]:
tritan.fit(mdata)
/mnt/iusers01/fatpou01/bmh01/t48955xm/.conda/envs/maxxxxxxxin/lib/python3.9/site-packages/TriTan/TriTan.py:225: RuntimeWarning: invalid value encountered in divide
  result = np.matmul(xv.transpose(), yv) / np.sqrt(np.outer(xvss, yvss))
/mnt/iusers01/fatpou01/bmh01/t48955xm/.conda/envs/maxxxxxxxin/lib/python3.9/site-packages/TriTan/TriTan.py:225: RuntimeWarning: invalid value encountered in divide
  result = np.matmul(xv.transpose(), yv) / np.sqrt(np.outer(xvss, yvss))
[60]:
mdata
[60]:
MuData object with n_obs × n_vars = 30669 × 11863
  obs:      'celltype', 'tritan_cluster'
  obsm:     'ADT_X_pca', 'ADT_X_umap', 'ADT_isotype_controls', 'GEX_X_pca', 'GEX_X_umap', 'tritan_umap'
  2 modalities
    rna:    30669 x 11729
      var:  'n_cells', 'highly_variable', 'means', 'dispersions', 'dispersions_norm', 'group'
      uns:  'log1p', 'hvg'
    adt:    30669 x 134
      var:  'group'
[59]:
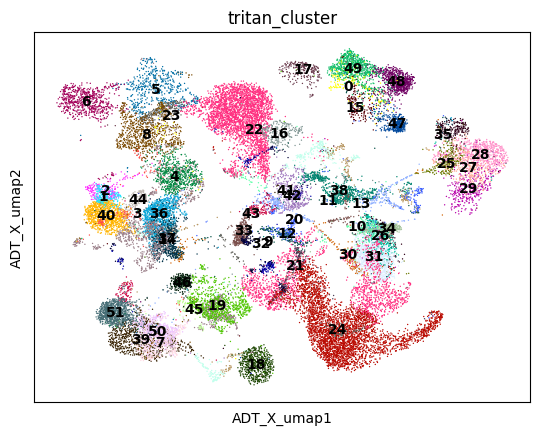
sc.pl.embedding(mdata, color ='tritan_cluster', basis='ADT_X_umap',legend_loc ='on data')
/mnt/iusers01/fatpou01/bmh01/t48955xm/.conda/envs/maxxxxxxxin/lib/python3.9/site-packages/scanpy/plotting/_tools/scatterplots.py:392: UserWarning: No data for colormapping provided via 'c'. Parameters 'cmap' will be ignored
  cax = scatter(
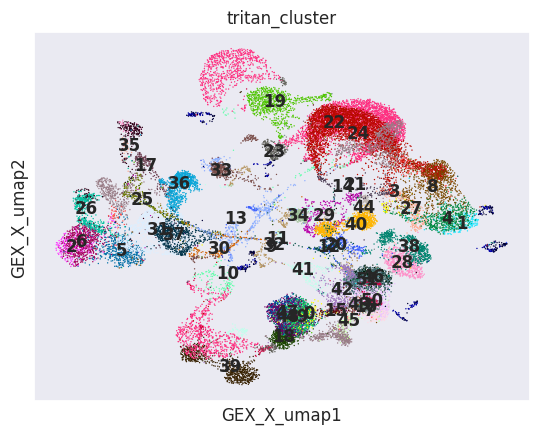
[69]:
sc.pl.embedding(mdata, color ='tritan_cluster', basis='GEX_X_umap',legend_loc ='on data')
/mnt/iusers01/fatpou01/bmh01/t48955xm/.conda/envs/maxxxxxxxin/lib/python3.9/site-packages/scanpy/plotting/_tools/scatterplots.py:392: UserWarning: No data for colormapping provided via 'c'. Parameters 'cmap' will be ignored
  cax = scatter(
Find signature feature groups for each cell cype
[63]:
S_gene = tritan.S_gene
S_adt = tritan.S_atac
S_gene = normalize(S_gene, axis=0, norm='max')
S_adt = normalize(S_adt, axis=0, norm='max')
[64]:
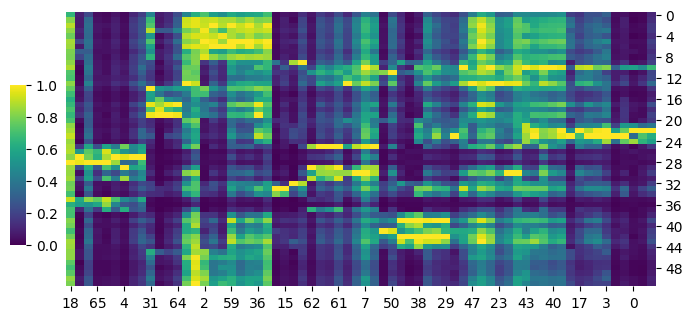
cg = sns.clustermap(S_gene,row_cluster=False,col_cluster=True,figsize=(8, 4), metric='correlation',cbar_pos=(0.14, .2, .02, .4),cmap='viridis')
cg.ax_row_dendrogram.set_visible(False)
cg.ax_col_dendrogram.set_visible(False)
[65]:
cg = sns.clustermap(S_adt,row_cluster=False,col_cluster=True,figsize=(8, 4), metric='correlation',cbar_pos=(0.14, .2, .02, .4),cmap='viridis')
cg.ax_row_dendrogram.set_visible(False)
cg.ax_col_dendrogram.set_visible(False)

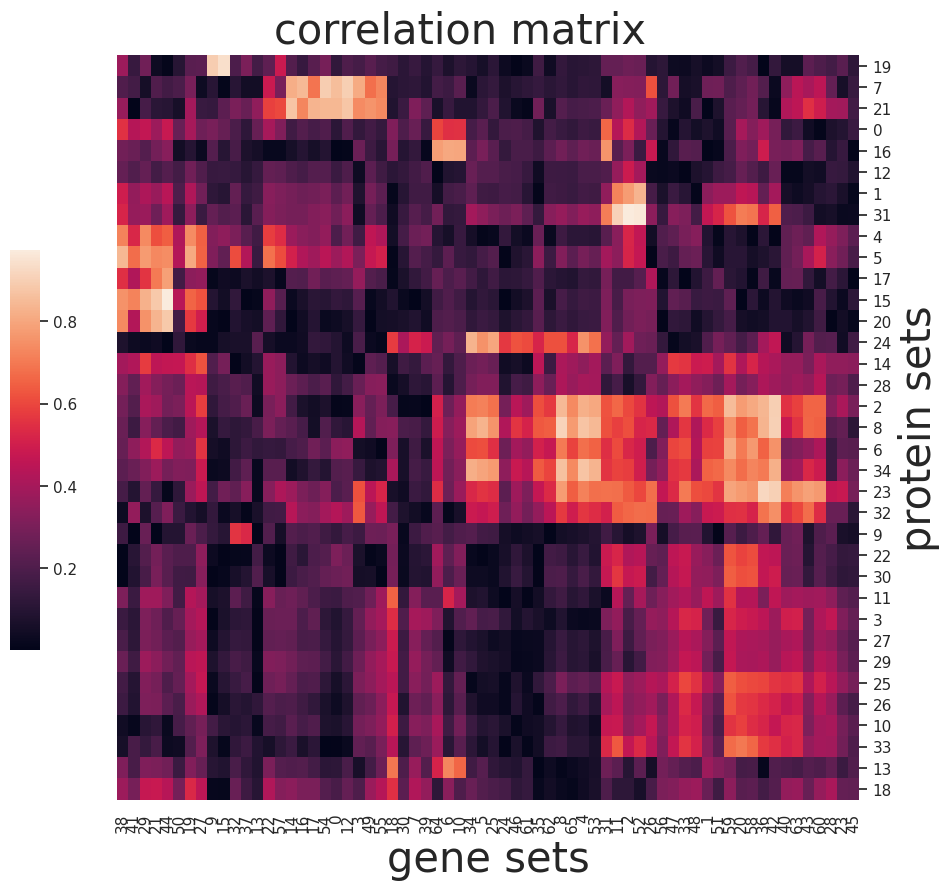
Find associations of feature groups across omics
[66]:
def np_pearson_cor(x, y):
    xv = x - x.mean(axis=0)
    yv = y - y.mean(axis=0)
    xvss = (xv * xv).sum(axis=0)
    yvss = (yv * yv).sum(axis=0)
    result = np.matmul(xv.transpose(), yv) / np.sqrt(np.outer(xvss, yvss))
    # bound the values to -1 to 1 in the event of precision issues
    return np.maximum(np.minimum(result, 1.0), -1.0)
[67]:
I = np_pearson_cor(S_adt,S_gene)
[68]:
sns.set(font_scale=1)
g=sns.clustermap(np.abs(I),figsize=(10, 10),
    cbar_pos=(0.1, .2, .03, .4), metric='correlation',yticklabels=True,xticklabels=True)
ax = g.ax_heatmap
g.ax_row_dendrogram.set_visible(False)
g.ax_col_dendrogram.set_visible(False)
ax.set_xlabel('gene sets', fontsize=30)
ax.set_ylabel('protein sets', fontsize=30)
plt.title('correlation matrix', fontsize=30,x=15,y=1.5)
[68]:
Text(15, 1.5, 'correlation matrix')
Saving the process
[ ]:
mdata.write("./cite_seq.h5mu")