Integrating scRNA-seq and scATAC-seq of PBMC-10K
Load libraries and data
Import required libraries
[1]:
from sklearn.preprocessing import normalize
from matplotlib import pyplot as plt
import seaborn as sns
import mudata as md
import scanpy as sc
import numpy as np
import muon as mu
import TriTan
/mnt/iusers01/fatpou01/bmh01/t48955xm/.conda/envs/maxxxxxxxin/lib/python3.9/site-packages/tqdm/auto.py:22: TqdmWarning: IProgress not found. Please update jupyter and ipywidgets. See https://ipywidgets.readthedocs.io/en/stable/user_install.html
  from .autonotebook import tqdm as notebook_tqdm
Load the MuData object from the .h5mu file. The MuData object contains gene expression data and tf-idf transformed open chromatin data.
[2]:
mdata = md.read("/scratch/t48955xm/PBMC-Multiome10k/PBMC10k_tp_mudata_hvg.h5mu")
[3]:
mdata
[3]:
MuData object with n_obs × n_vars = 11787 × 114392
  obs:      'celltype'
  var:      'n_cells', 'highly_variable', 'means', 'dispersions', 'dispersions_norm'
  obsm:     'X_emd'
  2 modalities
    RNA:    11787 x 14796
      var:  'n_cells', 'highly_variable', 'means', 'dispersions', 'dispersions_norm'
      uns:  'hvg', 'log1p'
    ATAC:   11787 x 99596
      var:  'n_cells', 'highly_variable', 'means', 'dispersions', 'dispersions_norm'
      uns:  'hvg'
Integrate data
TriTan can be run on a MuData object with a single command:
[4]:
tritan = TriTan.TriTan()
[5]:
tritan.fit(mdata)
/net/scratch2/t48955xm/TriTan.py:222: RuntimeWarning: invalid value encountered in divide
  result = np.matmul(xv.transpose(), yv) / np.sqrt(np.outer(xvss, yvss))
/net/scratch2/t48955xm/TriTan.py:222: RuntimeWarning: invalid value encountered in divide
  result = np.matmul(xv.transpose(), yv) / np.sqrt(np.outer(xvss, yvss))
Interpret the results
Cell clusters inferred by TriTan are stored in the mdata.obs[‘tritan_cluster’]
Feature groups inferred by TriTan are stored in mdata.mod[mod].var[‘group’]
Joint embedding is stored in mdata.obsm[‘tritan_umap’]
[7]:
mdata
[7]:
MuData object with n_obs × n_vars = 11787 × 114392
  obs:      'celltype', 'tritan_cluster'
  var:      'n_cells', 'highly_variable', 'means', 'dispersions', 'dispersions_norm'
  obsm:     'X_emd', 'tritan_umap'
  2 modalities
    RNA:    11787 x 14796
      var:  'n_cells', 'highly_variable', 'means', 'dispersions', 'dispersions_norm', 'group'
      uns:  'hvg', 'log1p'
    ATAC:   11787 x 99596
      var:  'n_cells', 'highly_variable', 'means', 'dispersions', 'dispersions_norm', 'group'
      uns:  'hvg'
Visualize the cell clusters
[8]:
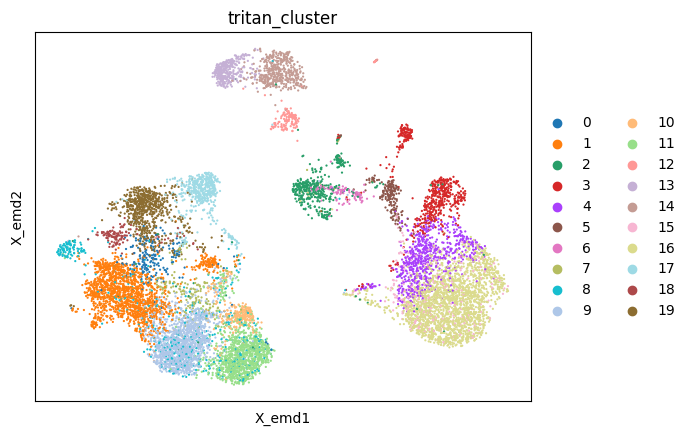
sc.pl.embedding(mdata, color ='tritan_cluster', basis='X_emd')
/mnt/iusers01/fatpou01/bmh01/t48955xm/.conda/envs/maxxxxxxxin/lib/python3.9/site-packages/scanpy/plotting/_tools/scatterplots.py:392: UserWarning: No data for colormapping provided via 'c'. Parameters 'cmap' will be ignored
  cax = scatter(
Visualize the joint embedding
[9]:
sc.pl.embedding(mdata, color ='celltype', basis='tritan_umap')
/mnt/iusers01/fatpou01/bmh01/t48955xm/.conda/envs/maxxxxxxxin/lib/python3.9/site-packages/scanpy/plotting/_tools/scatterplots.py:392: UserWarning: No data for colormapping provided via 'c'. Parameters 'cmap' will be ignored
  cax = scatter(

Find signature feature groups for each cell cype
[10]:
S_gene = tritan.S_gene
S_atac = tritan.S_atac
[11]:
S_atac = normalize(S_atac, axis=0, norm='max')
S_gene = normalize(S_gene, axis=0, norm='max')
[12]:
cg = sns.clustermap(S_gene,row_cluster=False,col_cluster=True,figsize=(8, 4), metric='correlation',cbar_pos=(0.14, .2, .02, .4),cmap='viridis')
cg.ax_row_dendrogram.set_visible(False)
cg.ax_col_dendrogram.set_visible(False)

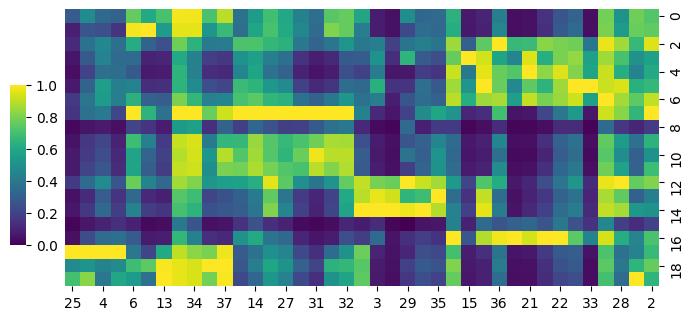
[13]:
cg = sns.clustermap(S_atac,row_cluster=False,col_cluster=True,figsize=(8, 4), metric='correlation',cbar_pos=(0.14, .2, .02, .4),cmap='viridis')
cg.ax_row_dendrogram.set_visible(False)
cg.ax_col_dendrogram.set_visible(False)
Find associations of feature groups across omics
[14]:
def np_pearson_cor(x, y):
    xv = x - x.mean(axis=0)
    yv = y - y.mean(axis=0)
    xvss = (xv * xv).sum(axis=0)
    yvss = (yv * yv).sum(axis=0)
    result = np.matmul(xv.transpose(), yv) / np.sqrt(np.outer(xvss, yvss))
    # bound the values to -1 to 1 in the event of precision issues
    return np.maximum(np.minimum(result, 1.0), -1.0)
[17]:
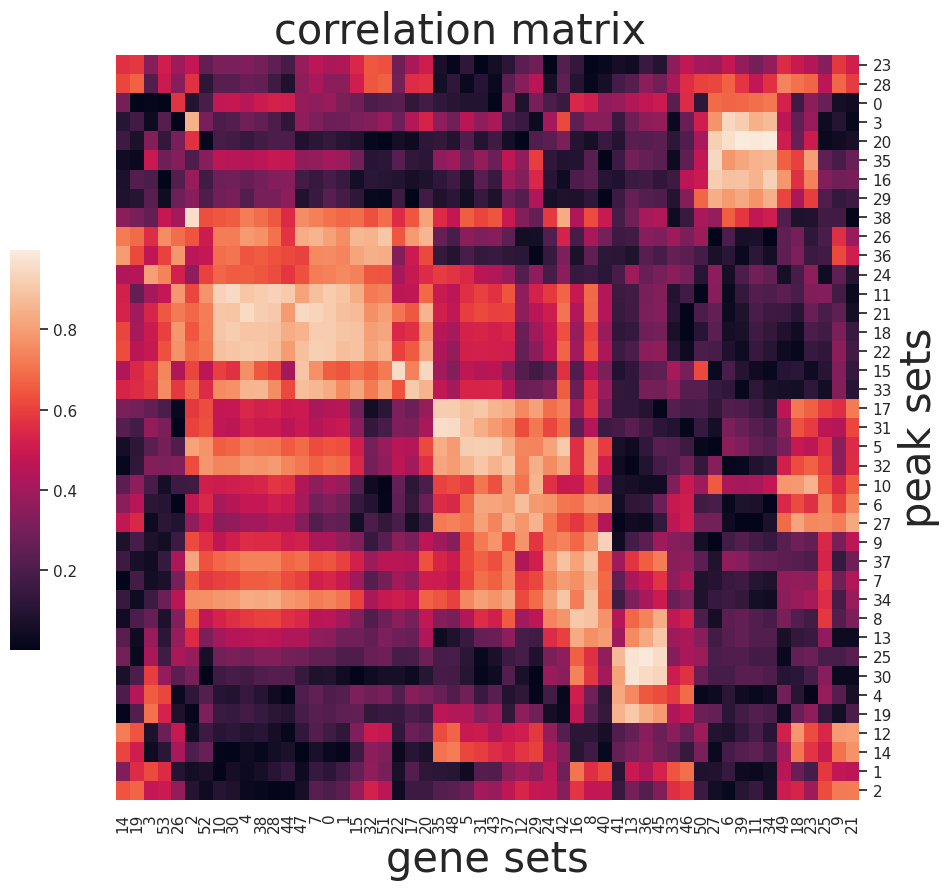
I = np_pearson_cor(S_atac,S_gene)
[19]:
sns.set(font_scale=1)
g=sns.clustermap(np.abs(I),figsize=(10, 10),
    cbar_pos=(0.1, .2, .03, .4), metric='correlation',yticklabels=True,xticklabels=True)
ax = g.ax_heatmap
g.ax_row_dendrogram.set_visible(False)
g.ax_col_dendrogram.set_visible(False)
ax.set_xlabel('gene sets', fontsize=30)
ax.set_ylabel('peak sets', fontsize=30)
plt.title('correlation matrix', fontsize=30,x=15,y=1.5)
[19]:
Text(15, 1.5, 'correlation matrix')
Saving progress
[ ]:
mdata.write("/scratch/t48955xm/PBMC-Multiome10k/PBMC10k_tp_mudata_hvg.h5mu")