Intergrating Tri-OMICS
[137]:
import matplotlib.pyplot as plt
from matplotlib.gridspec import GridSpec
from sklearn.preprocessing import normalize
from mudata import MuData
import os.path as path
import seaborn as sns
import numexpr as ne
import pandas as pd
import scanpy as sc
import mudata as md
import numpy as np
import muon as mu
import anndata
import h5py
import time
import umap
import gc
data introduction and prepocessing
[49]:
adata_adt=sc.read_h5ad("adt_obj.h5ad")
adata_rna=sc.read_h5ad("rna_obj.h5ad")
adata_atac=sc.read_h5ad("atac_obj.h5ad")
[54]:
adata_rna
[54]:
AnnData object with n_obs × n_vars = 13763 × 15360
    obs: 'orig.ident', 'nCount_RNA', 'nFeature_RNA', 'stim', 'celltype', 'nCount_atac', 'nFeature_atac', 'nCount_adt', 'nFeature_adt'
    var: 'features', 'n_cells', 'highly_variable', 'means', 'dispersions', 'dispersions_norm'
    uns: 'log1p', 'hvg'
[55]:
adata_atac
[55]:
AnnData object with n_obs × n_vars = 13763 × 68963
    obs: 'orig.ident', 'nCount_atac', 'nFeature_atac', 'nCount_RNA', 'nFeature_RNA', 'stim', 'celltype', 'nCount_adt', 'nFeature_adt'
    var: 'features', 'highly_variable', 'means', 'dispersions', 'dispersions_norm'
    uns: 'log1p', 'hvg'
[56]:
adata_adt
[56]:
AnnData object with n_obs × n_vars = 13763 × 210
    obs: 'orig.ident', 'nCount_adt', 'nFeature_adt', 'nCount_RNA', 'nFeature_RNA', 'stim', 'celltype', 'nCount_atac', 'nFeature_atac'
    var: 'features'
[50]:
sc.pp.filter_genes(adata_rna, min_cells = 50)
sc.pp.normalize_total(adata_rna, target_sum=1e4)
sc.pp.log1p(adata_rna)
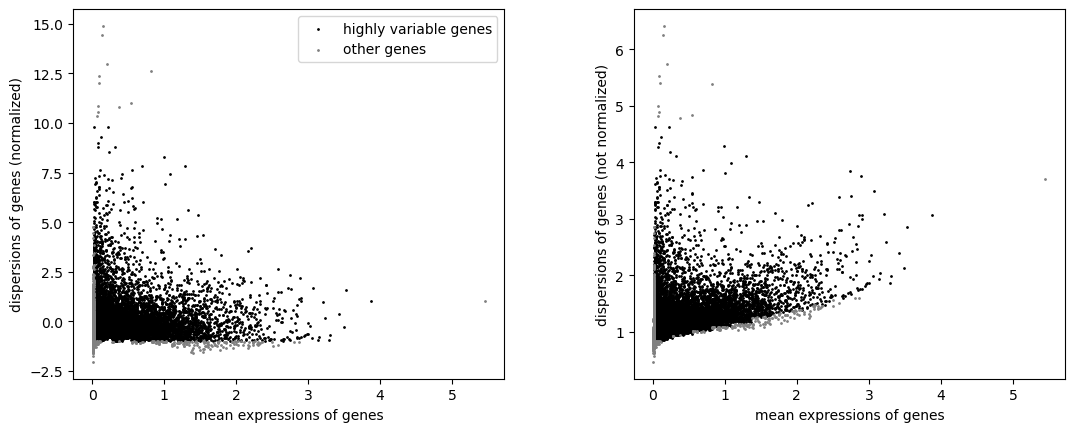
sc.pp.highly_variable_genes(adata_rna, min_mean=0.02, max_mean=4, min_disp= -1, max_disp = 10)
sc.pl.highly_variable_genes(adata_rna)
[51]:
HVG = adata_rna[:, adata_rna.var['highly_variable'] == True]
[52]:
sc.pp.log1p(adata_atac)
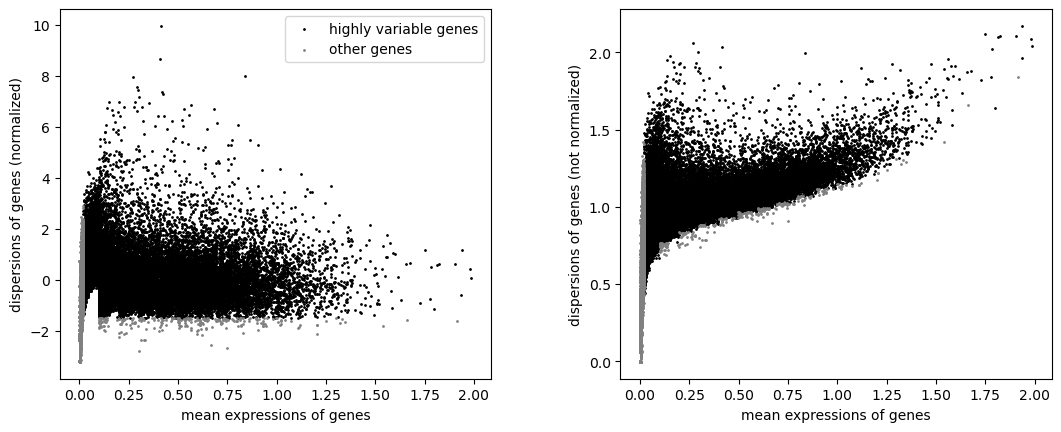
sc.pp.highly_variable_genes(adata_atac, min_mean=0.02, max_mean=4, min_disp= -1.5, max_disp = 10)
sc.pl.highly_variable_genes(adata_atac)
[53]:
HVP = adata_atac[:, adata_atac.var['highly_variable'] == True]
[57]:
mdata = mu.MuData({'rna': HVG, 'atac': HVP, 'adt':adata_adt})
/home/data/ssy092/miniconda3/envs/maxine/lib/python3.11/site-packages/mudata/_core/mudata.py:1531: FutureWarning: From 0.4 .update() will not pull obs/var columns from individual modalities by default anymore. Set mudata.set_options(pull_on_update=False) to adopt the new behaviour, which will become the default. Use new pull_obs/pull_var and push_obs/push_var methods for more flexibility.
  self._update_attr("var", axis=0, join_common=join_common)
/home/data/ssy092/miniconda3/envs/maxine/lib/python3.11/site-packages/mudata/_core/mudata.py:931: UserWarning: Cannot join columns with the same name because var_names are intersecting.
  warnings.warn(
/home/data/ssy092/miniconda3/envs/maxine/lib/python3.11/site-packages/mudata/_core/mudata.py:1429: FutureWarning: From 0.4 .update() will not pull obs/var columns from individual modalities by default anymore. Set mudata.set_options(pull_on_update=False) to adopt the new behaviour, which will become the default. Use new pull_obs/pull_var and push_obs/push_var methods for more flexibility.
  self._update_attr("obs", axis=1, join_common=join_common)
[59]:
mdata.obs['celltype'] = adata_rna.obs['celltype']
[60]:
mdata
[60]:
MuData object with n_obs × n_vars = 13763 × 65654
  obs:      'celltype'
  3 modalities
    rna:    13763 x 13002
      obs:  'orig.ident', 'nCount_RNA', 'nFeature_RNA', 'stim', 'celltype', 'nCount_atac', 'nFeature_atac', 'nCount_adt', 'nFeature_adt'
      var:  'features', 'n_cells', 'highly_variable', 'means', 'dispersions', 'dispersions_norm'
      uns:  'log1p', 'hvg'
    atac:   13763 x 52442
      obs:  'orig.ident', 'nCount_atac', 'nFeature_atac', 'nCount_RNA', 'nFeature_RNA', 'stim', 'celltype', 'nCount_adt', 'nFeature_adt'
      var:  'features', 'highly_variable', 'means', 'dispersions', 'dispersions_norm'
      uns:  'log1p', 'hvg'
    adt:    13763 x 210
      obs:  'orig.ident', 'nCount_adt', 'nFeature_adt', 'nCount_RNA', 'nFeature_RNA', 'stim', 'celltype', 'nCount_atac', 'nFeature_atac'
      var:  'features'
running TriTan
[ ]:
import TriTan
[115]:
n_component= {'rna': [20,50], 'atac': [20,50], 'adt': [20,50]}
[116]:
tritan = TriTan_multi.TriTan(n_modalities = 3, n_component=n_component,complexity = 10)
[117]:
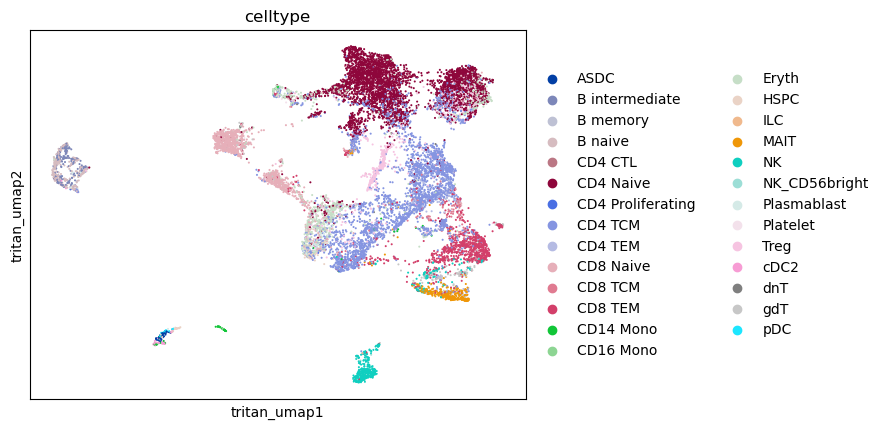
tritan.fit(mdata)
/home/data1/ssy092/maxine_neurip/TriTan_multi.py:255: RuntimeWarning: invalid value encountered in divide
  # bound the values to -1 to 1 in the event of precision issues
/home/data1/ssy092/maxine_neurip/TriTan_multi.py:255: RuntimeWarning: invalid value encountered in divide
  # bound the values to -1 to 1 in the event of precision issues
[119]:
sc.pl.embedding(mdata, color ='celltype', basis='tritan_umap')
downstream analysis
[120]:
S_gene = tritan.S['rna']
S_atac = tritan.S['atac']
S_adt = tritan.S['adt']
S_gene = normalize(S_gene, axis=0, norm='max')
S_atac = normalize(S_atac, axis=0, norm='max')
S_adt = normalize(S_adt, axis=0, norm='max')
[121]:
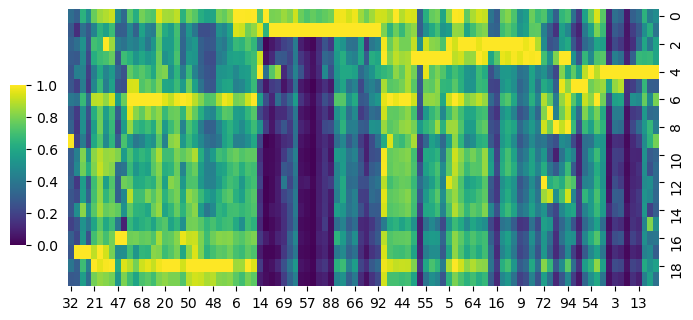
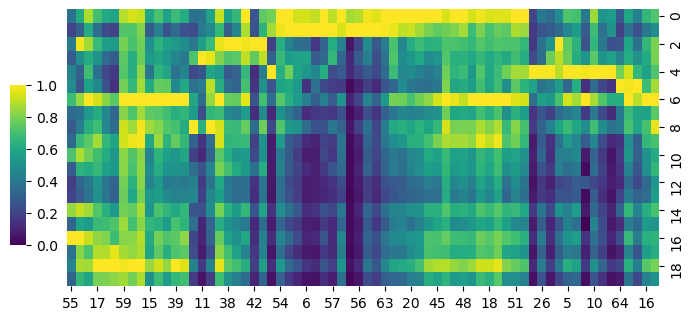
cg = sns.clustermap(S_gene,row_cluster=False,col_cluster=True,figsize=(8, 4), metric='correlation',cbar_pos=(0.14, .2, .02, .4),cmap='viridis')
cg.ax_row_dendrogram.set_visible(False)
cg.ax_col_dendrogram.set_visible(False)
[122]:
cg = sns.clustermap(S_atac,row_cluster=False,col_cluster=True,figsize=(8, 4), metric='correlation',cbar_pos=(0.14, .2, .02, .4),cmap='viridis')
cg.ax_row_dendrogram.set_visible(False)
cg.ax_col_dendrogram.set_visible(False)
[123]:
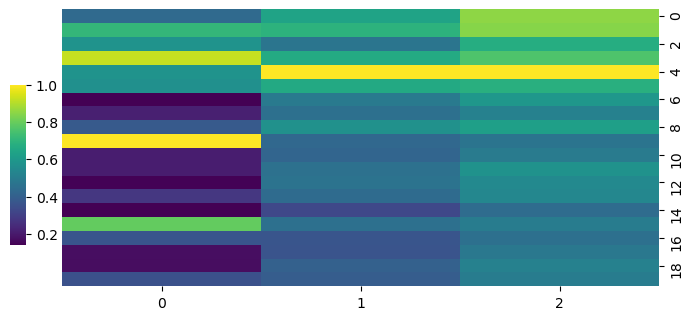
cg = sns.clustermap(S_adt,row_cluster=False,col_cluster=True,figsize=(8, 4), metric='correlation',cbar_pos=(0.14, .2, .02, .4),cmap='viridis')
cg.ax_row_dendrogram.set_visible(False)
cg.ax_col_dendrogram.set_visible(False)
[125]:
def np_pearson_cor(x, y):
    xv = x - x.mean(axis=0)
    yv = y - y.mean(axis=0)
    xvss = (xv * xv).sum(axis=0)
    yvss = (yv * yv).sum(axis=0)
    result = np.matmul(xv.transpose(), yv) / np.sqrt(np.outer(xvss, yvss))
    # bound the values to -1 to 1 in the event of precision issues
    return np.maximum(np.minimum(result, 1.0), -1.0)
[126]:
I1 = np_pearson_cor(S_gene,S_atac)
I2 = np_pearson_cor(S_gene,S_adt)
I3 = np_pearson_cor(S_atac,S_adt)
[144]:
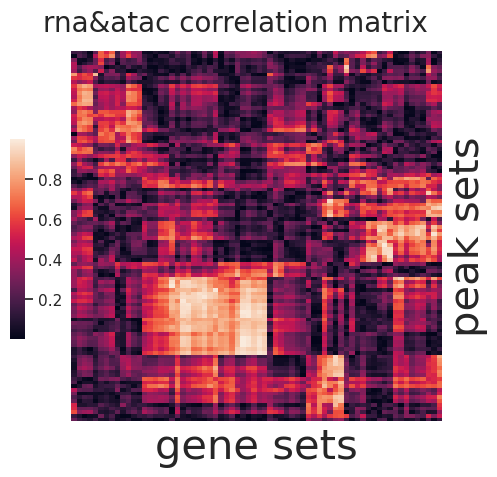
sns.set(font_scale=1)
g=sns.clustermap(np.abs(I1),figsize=(5, 5),
    cbar_pos=(0.1, .2, .03, .4), metric='correlation',yticklabels=False,xticklabels=False)
ax = g.ax_heatmap
g.ax_row_dendrogram.set_visible(False)
g.ax_col_dendrogram.set_visible(False)
ax.set_xlabel('gene sets', fontsize=30)
ax.set_ylabel('peak sets', fontsize=30)
plt.title('rna&atac correlation matrix', fontsize=20,x=15,y=1.5)
[144]:
Text(15, 1.5, 'rna&atac correlation matrix')
[145]:
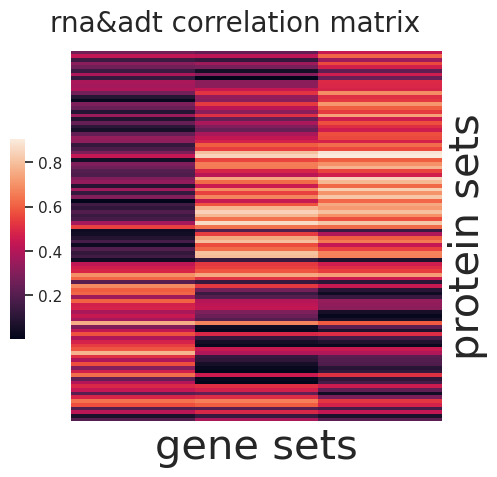
sns.set(font_scale=1)
g=sns.clustermap(np.abs(I2),figsize=(5, 5),
    cbar_pos=(0.1, .2, .03, .4), metric='correlation',yticklabels=False,xticklabels=False)
ax = g.ax_heatmap
g.ax_row_dendrogram.set_visible(False)
g.ax_col_dendrogram.set_visible(False)
ax.set_xlabel('protein sets', fontsize=30)
ax.set_ylabel('gene sets', fontsize=30)
plt.title('rna&adt correlation matrix', fontsize=20,x=15,y=1.5)
[145]:
Text(15, 1.5, 'rna&adt correlation matrix')
[146]:
sns.set(font_scale=1)
g=sns.clustermap(np.abs(I3),figsize=(5, 5),
    cbar_pos=(0.1, .2, .03, .4), metric='correlation',yticklabels=False,xticklabels=False)
ax = g.ax_heatmap
g.ax_row_dendrogram.set_visible(False)
g.ax_col_dendrogram.set_visible(False)
ax.set_xlabel('protein setspeak sets', fontsize=30)
ax.set_ylabel('', fontsize=30)
plt.title('atac&adt correlation matrix', fontsize=20,x=15,y=1.5)
[146]:
Text(15, 1.5, 'atac&adt correlation matrix')

[ ]: